Like I said in my earlier post, I used a
Fluke OptiView to find the protocols in use and what machines were having “conversations” over those protocols. Unfortunately, my budget won’t allow for the $25K to purchase my own so I started looking for alternatives. I found that Ethereal can do most of what I did with the Fluke for the grand cost of $0 (plus a computer to run it on, but I already have a bunch of those).
Here is my very lame, newbie to Ethereal how-to so I can remember how I did it. If anyone knows of a better site on this, please let me know… Hopefully someone else will find it useful.
The first step is to install Ethereal. If you can’t get this figured out, I’m not sure the rest of this document is for you. I used windows, because the copy I usually use on Knoppix-STD didn’t have the features I needed. I have no idea if that version is out of date or if the windows version is ahead of the Linux version. If I figure it out, I’ll let you know.
I started by configuring the preferences to allow packet capture in interactive mode.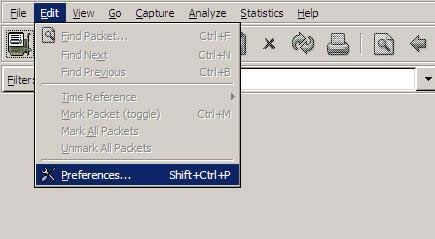
Under capture, the boxes “Capture packets in promiscious mode” and “Update list of packets in real time” need to be checked. You can do whatever you want with the other two.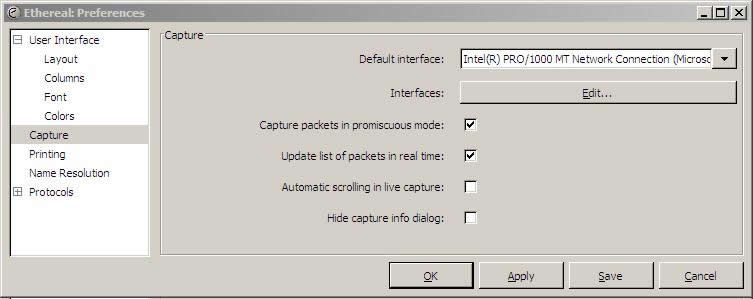
Then Select “Live Capture” from the “Capture” menu in the top menu bar, and you should see a screen like this:
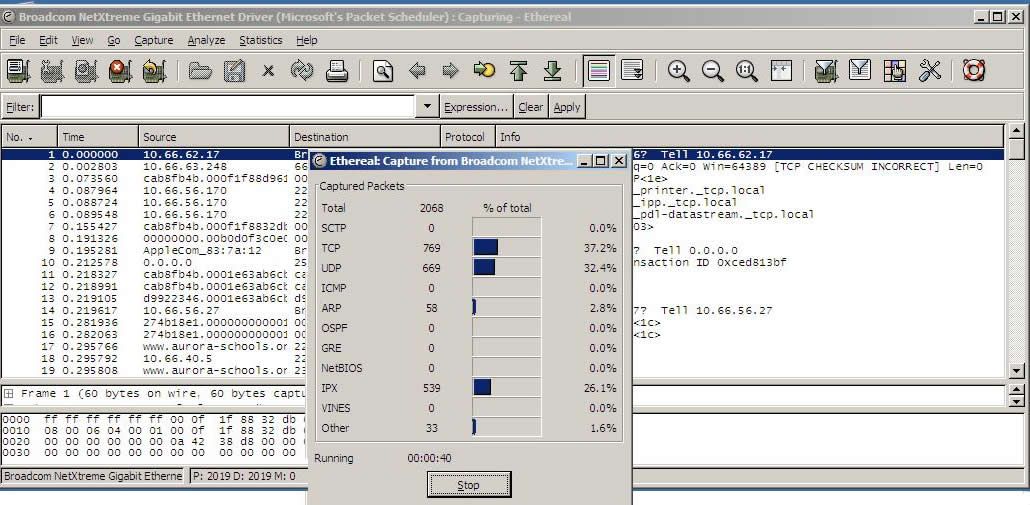 You can minimize or mobe the Capture Info dialog box – and if you checked “Hide capture info dialog” in the prefs, it won’t show up at all.
To start looking into what protocols are in use, sellect “Protocol Hierarchy” from the “Statistics” menu.
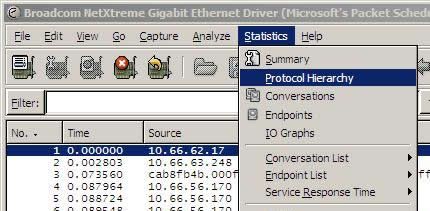
You should then see this screen – depicting what protocols are in use and the % they use:
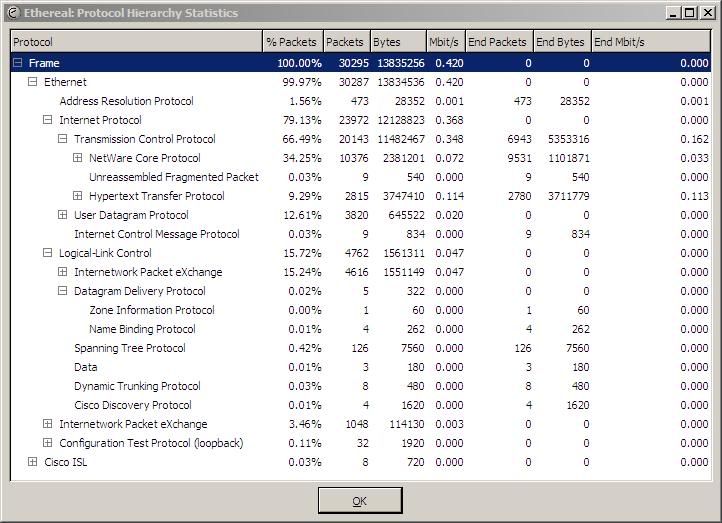
This example is a little atypical as I am sampling a switched node and only see my traffic and broadcast traffic – this is whyNCP and IPX are such high percentages.
To look at the “Conversations” between machines, pick “Conversations” from the “Statistics” menu.
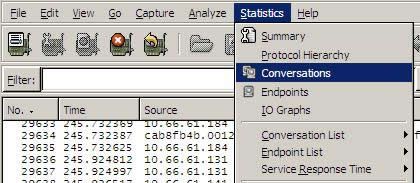
This will give you a “live” view of who is talking on your network. In the screen below, you can see the traffic I was generating while browsing the web.
The top address is the server where I mistakenly was saving the protocol dump, generating plenty of traffic in and of itself!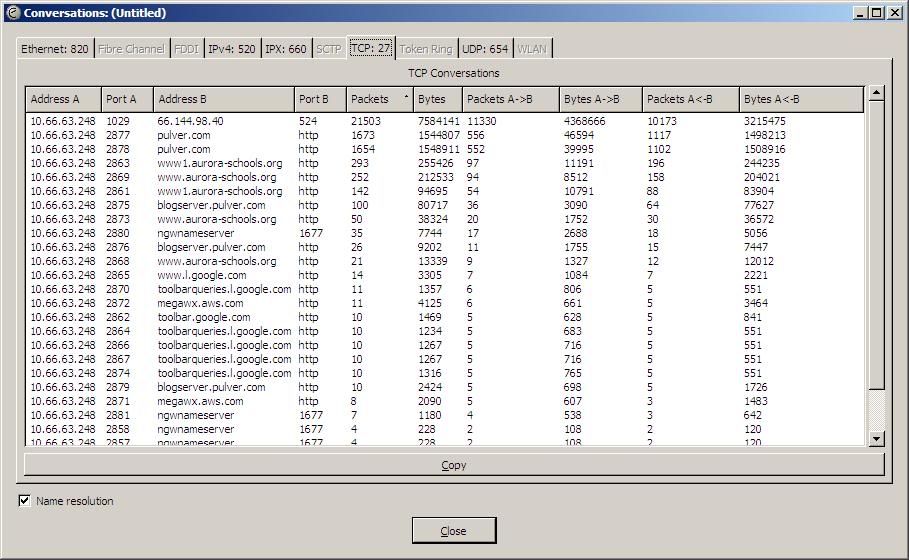
Another useful tool is filtering. You can filter by address, protocol, or both. The example below shows filtering web traffic for a single IP address.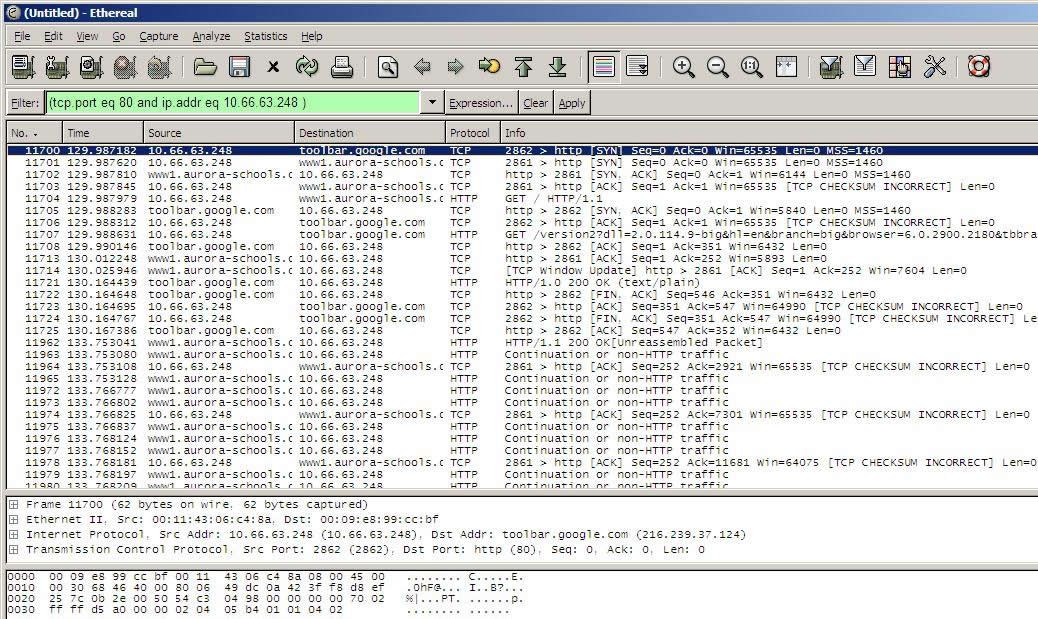
Ethereal will also automatically decode the traffic for most protocols. Right clicking on a packet, and selecting “Follow TCP Stream” will bring up a decode of the entrie stream, as shown in the two pictures below: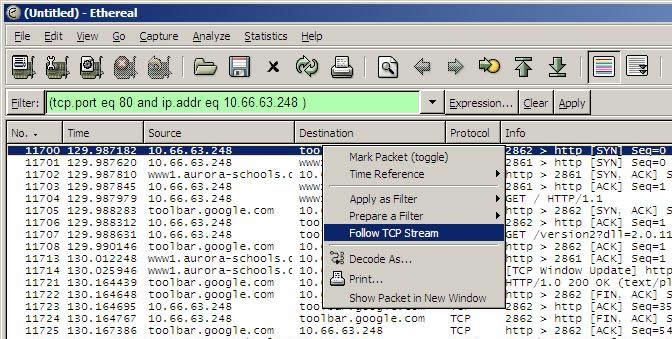
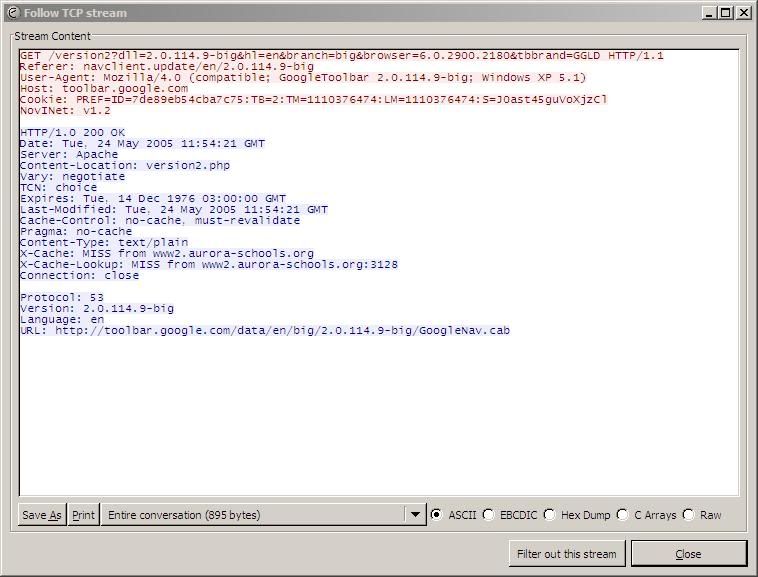
This shows a request from the Google toolbar to download an automatic update. This is exactly how I was able to determine that most of the additional traffic on my site was caused by automatic updates of WinXP SP2. Machines with 3GB hard drives were downloading it, and not able to install it due to disk space. On the next reboot, they would start downloading it all over again… Blocking it has now brought my traffic down to “regular” levels.